
1. Define what counts as a stop
A scheduled break, waiting for material and a breakdown mean different things. Define planned production time, excluded breaks and the threshold at which an event becomes a recorded stop.
Use consistent rules across periods. Otherwise, a change in the indicator may simply reflect a change in its definition.
2. Measure and add context
Collect the start, end, machine and shift for each stop. Duration can come from a machine signal, but the cause often requires operator input.
- Use a short list of categories understood by the floor.
- Include an “unclassified” category instead of forcing a guessed cause.
- Validate timestamps and distinguish lost connectivity from actual stops.
- Review unclassified events with the team.
3. Prioritize duration and frequency
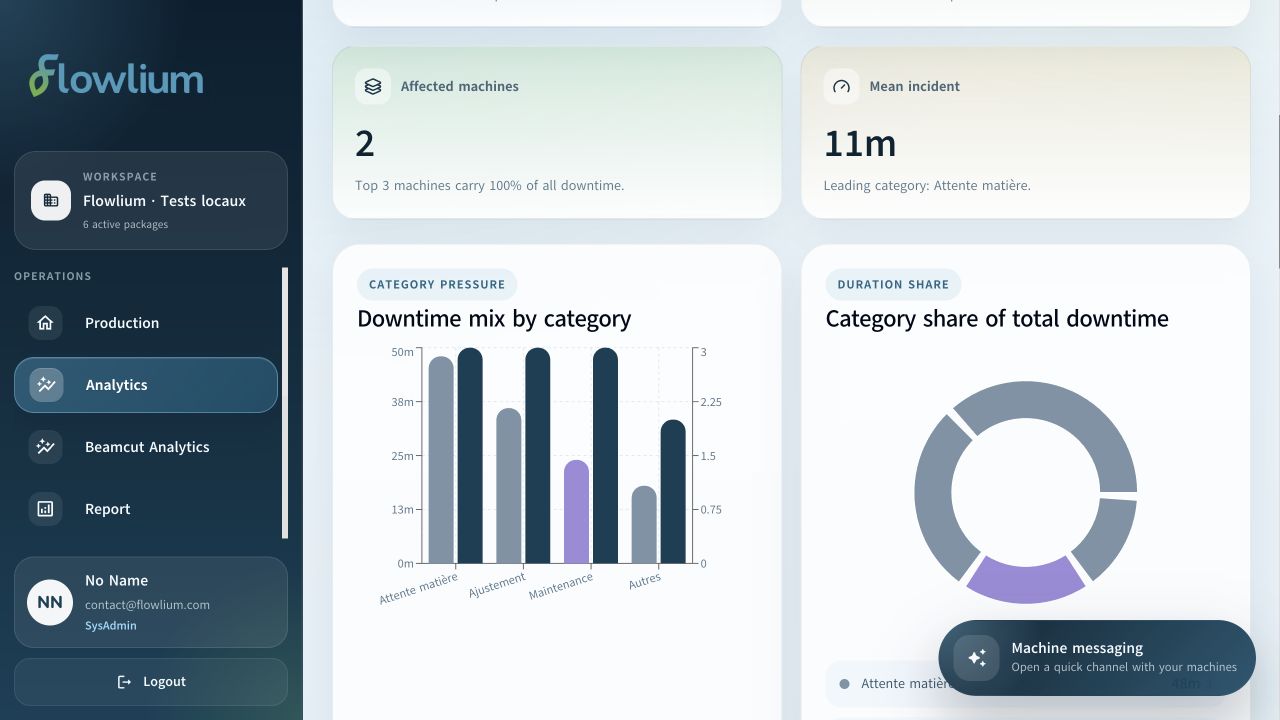
A ranking by cumulative duration reveals which categories consume the most time. Frequency adds another perspective: many brief stops can add up to a significant loss.
Fictional example: 48 minutes waiting for material, 36 minutes of setup, 24 minutes of maintenance and 18 minutes of other stops total 126 minutes. Material wait represents roughly 38% of the recorded time. That is a starting point for investigation, not proof of a root cause.
4. Test an action and measure its effect
Choose an action with an owner and a defined scope. Compare representative periods while accounting for product mix, production hours and operating conditions.
Flowlium helps make these events visible and track indicators. Improvement also relies on team knowledge and validation on the floor.