One shared production picture
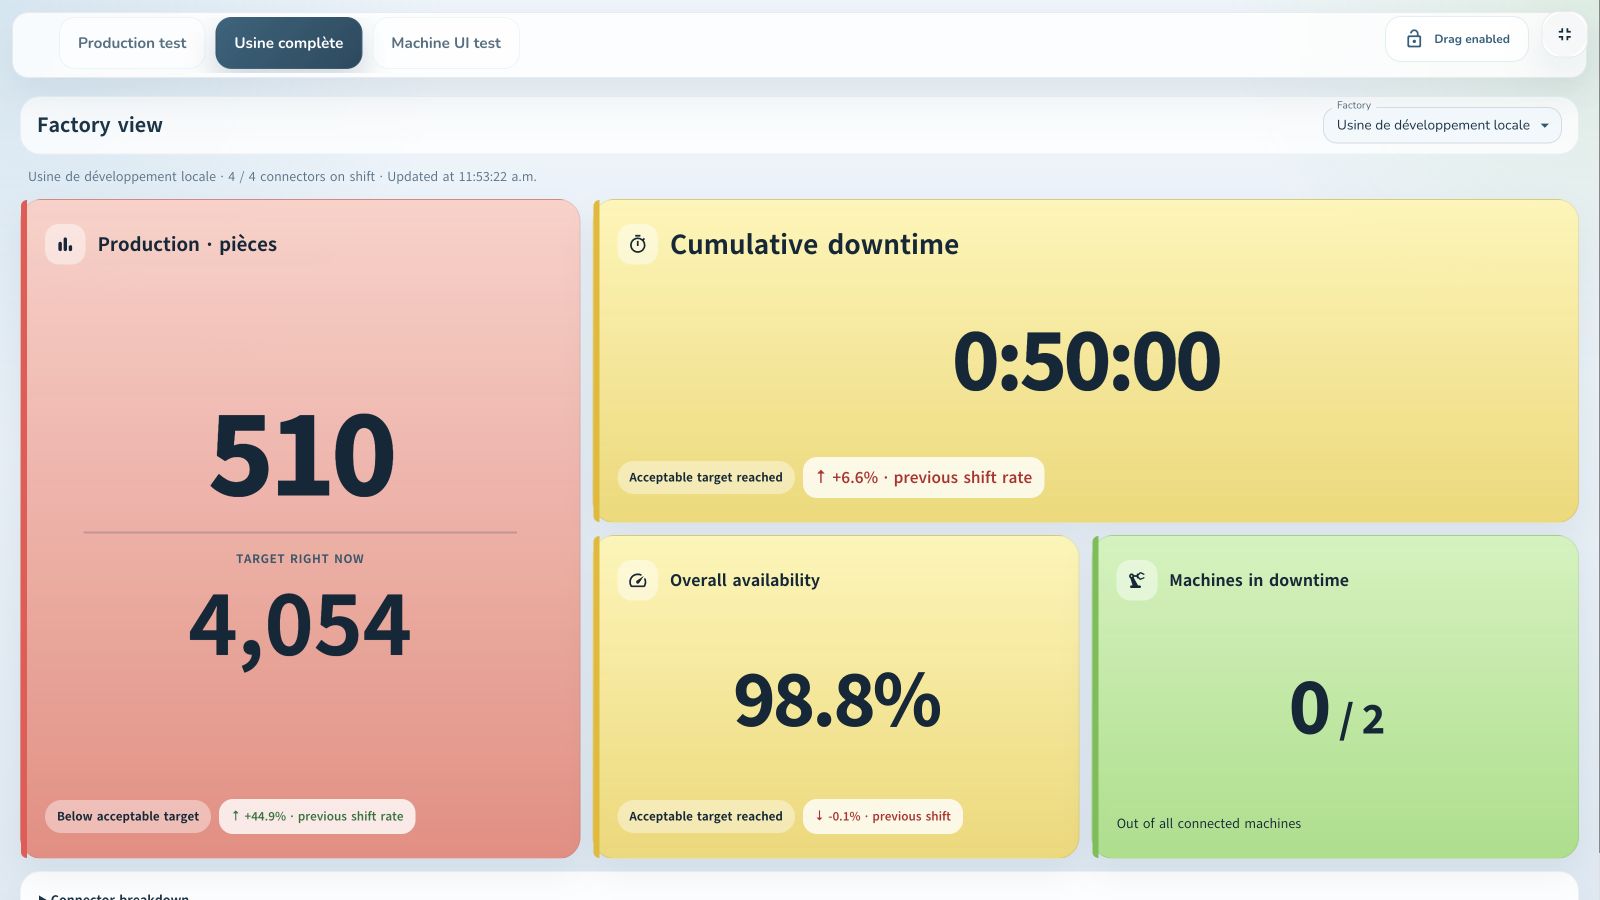
When information is spread across machines, files and manual logs, it is difficult to know whether a shift is meeting its targets. A factory overview brings indicators together so teams can identify gaps during operations.
- Produced quantities and shift targets.
- Availability based on run time and planned production time.
- Stopped machines and interruption duration.
- Connector details and history according to available data.
Connect the equipment you already have
Our connectors support different industrial realities. We find the right way to bring together the information that matters: production, machine status and events on the floor.
We validate access, the meaning of each signal and collection frequency with your team. Detecting a stop does not always explain its cause; operator categorization adds the context needed.
A starting scope that supports decisions
Choose a machine or line whose performance is hard to explain. Define an objective, observe a baseline period and check that data reflects events on the floor. Use those observations to target an action and compare results.
Practical questions. Clear answers.
Does monitoring replace operators?
It gives them visibility and context. Teams remain essential to explain events, choose actions and validate outcomes.
Is the data real time?
Freshness depends on the source and configured collection frequency. This is defined during integration to match the pace of your decisions.