
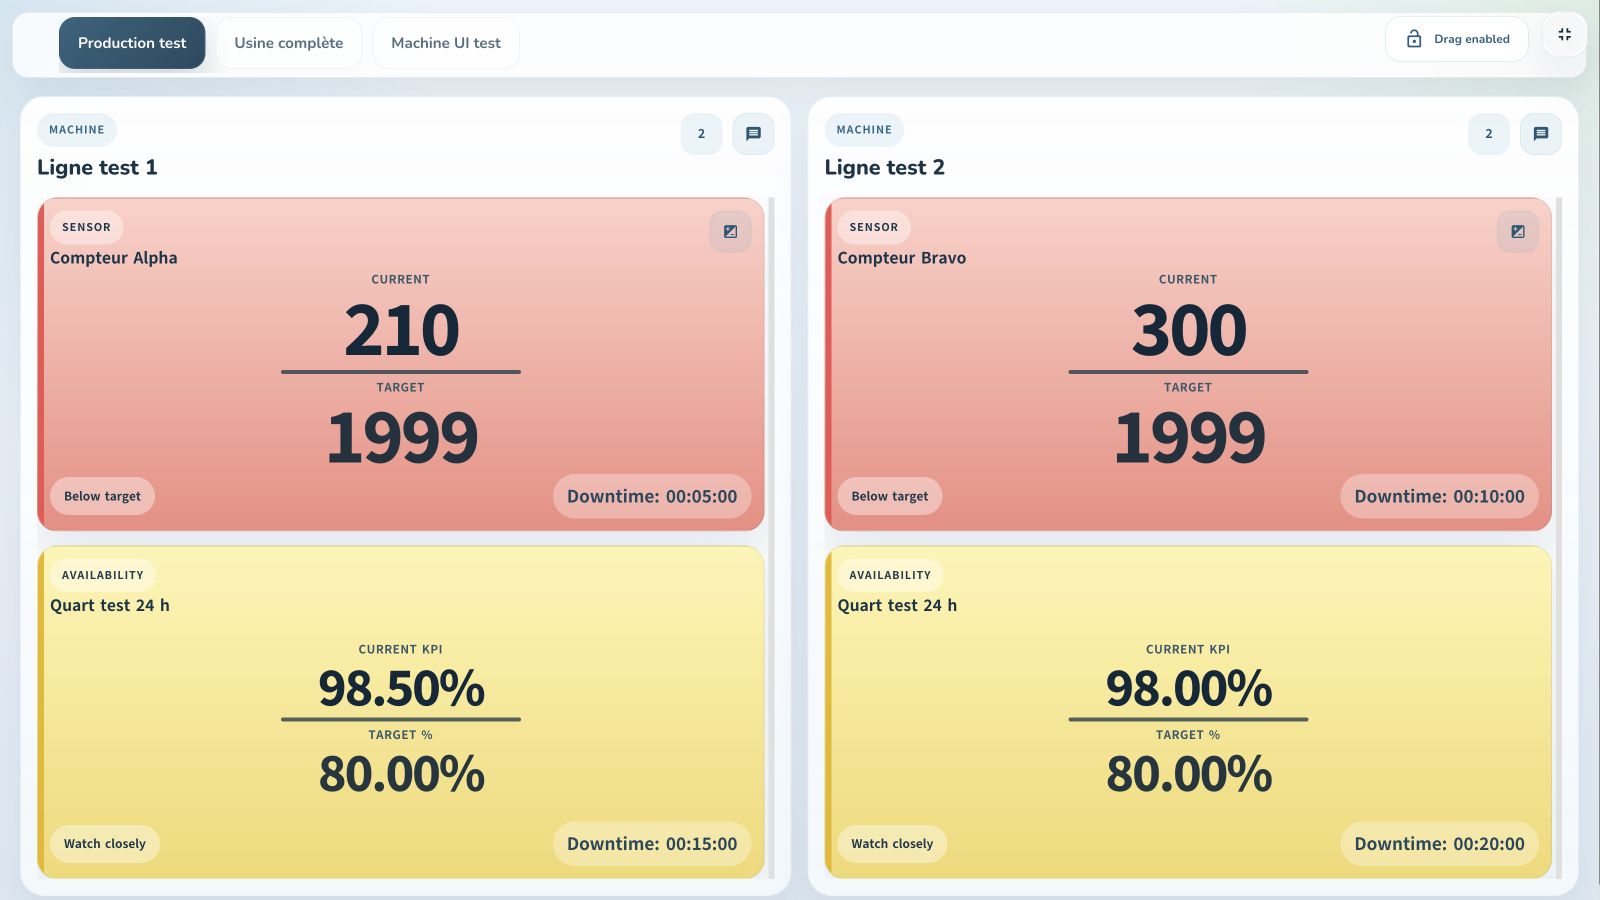
Connect indicators to decisions
A dashboard is useful when it helps someone decide what to do. Shift leaders need to know whether production is on target. Plant managers need to understand recurring losses and capacity constraints. We define views around those needs.
- Compare output with consistent targets.
- Analyze downtime by machine, category and period.
- Distinguish availability problems from production-rate problems.
- Share consistent indicators between operators and management.
Availability, performance and OEE: avoid shortcuts
Availability measures the share of planned production time during which a machine runs. Overall equipment effectiveness (OEE, or TRS in French) combines availability, performance and quality. These metrics are not interchangeable.
OEE requires validated planned time, run time, reference cycle rate, total count and good count. An availability percentage must not be presented as a complete OEE score.
Measure gains in a comparable context
Compare results before and after an action within a defined scope. Product mix, hours worked, staffing and equipment changes can affect the comparison.
Flowlium reports a 15% production increase observed in a client project, without adding employees or industrial machines. This result belongs to that project and is not a guarantee for another factory.
Practical questions. Clear answers.
Can production improve without buying machines?
Losses may come from downtime, organization or production-rate gaps. Measuring them helps determine whether existing capacity can be recovered before choosing an investment.
What data is needed to track OEE?
A counter alone cannot establish every OEE component. Scope and required sources must be validated to produce a meaningful indicator.